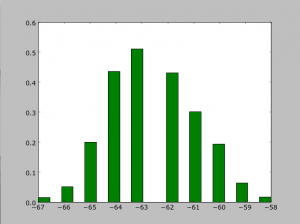
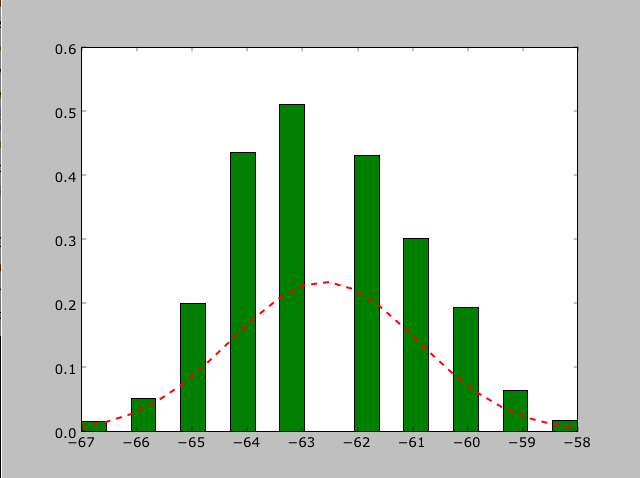
Let’s say you have a nice histogram, like this…
…and you want to fit a gaussian to it so that you can find the mean, and the standard deviation. Follow these steps!
First, we have to make sure we have the right modules imported
>>> import matplotlib.pyplot as plt
>>> import matplotlib.mlab as mlab
>>> from scipy.stats import norm
Let’s say your data is stored in some array called data.
>>> (mu,sigma) = norm.fit(data)
Mu is the mean, and sigma is one standard deviation. If you don’t care about plotting your data, you can stop here.
>>> plt.figure(1)
>>> n,bins,patches=plt.hist(data,20,normed=1,facecolor=’green’,align=’mid’)
The number after data (20) is the number of bins you want your data to go into. Normed has to do with the integral of the gaussian.
>>> y = mlab.normpdf(bins,mu,sigma)
>>> plt.plot(bins,y,’r–‘,linewidth=2)
Now your data is nicely plotted as a histogram and its corresponding gaussian!


