Regularizing Data

I have been trying to cross correlate two spectra with the intent of finding the radial velocity of one relative to the other.  I’ve been working on a Python code to do this for some time, but was having complications.  Although there is clearly a shift between the two spectra, the numpy cross correlation function that the code uses kept coming up with a shift of zero.  I recently came across the concept of “regularizing” data on a python help website.  Someone was having a similar problem (coming up with a cross correlation result of a zero shift), and it was pointed out that they weren’t regularizing their data.  To regularize data is to subtract off the mean, and divide by the standard deviation.  I tried doing this in my code, and it actually started to work, and give me very nice answers!  The problem is that I don’t particularly understand why this makes the cross correlation work.

Is anyone familiar with the concept of regularizing data? Or has anyone had a similar problem regarding cross correlations?

Fitting a gaussian to your data

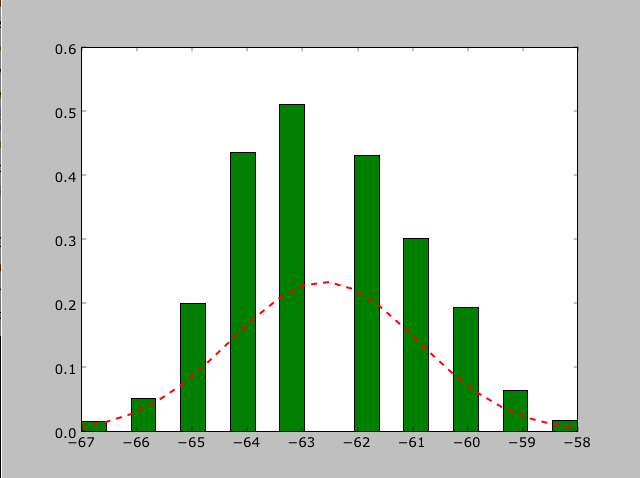
Let’s say you have a nice histogram, like this…

…and you want to fit a gaussian to it so that you can find the mean, and the standard deviation.  Follow these steps!

First, we have to make sure we have the right modules imported

>>> import matplotlib.pyplot as plt
>>> import matplotlib.mlab as mlab
>>> from scipy.stats import norm

Let’s say your data is stored in some array called data.

>>> (mu,sigma) = norm.fit(data)
Mu is the mean, and sigma is one standard deviation. If you don’t care about plotting your data, you can stop here.
>>> plt.figure(1)
>>> n,bins,patches=plt.hist(data,20,normed=1,facecolor=’green’,align=’mid’)
The number after data (20) is the number of bins you want your data to go into. Normed has to do with the integral of the gaussian.
>>> y = mlab.normpdf(bins,mu,sigma)
>>> plt.plot(bins,y,’r–‘,linewidth=2)

Now your data is nicely plotted as a histogram and its corresponding gaussian!

Finding radial velocities

I’ve made good progress on a Python code for finding the radial velocity of an object, and expect it to be done soon!  I’m looking forward to finding some radial velocities, and then using the information to determine cluster membership for the brown dwarfs in our sample.

I thought I’d just outline the very basic steps involved in finding radial velocity.

1) Cross correlation: cross correlate two spectra to find how much one is shifted in relation to the other (in pixels).  One of these spectra should be a standard for which the radial velocity is known.

2) Convert this shift in pixels to a shift in velocity.  Note that this is the velocity with respect to the standard object.

3) Subtract the velocity of the standard from the velocity shift to obtain the radial velocity of your object!


How to add data to the database

Here are some guidelines for inputting data into the BDNYC database!

Part 1: Opening database

This should be done in the directory in which you have the database stored.

>>> import pickle
>>> import BDNYC
>>> f=open(‘BDNYCData.txt’,’rb’)
>>> bdnyc=pickle.load(f)
>>> f.close()

IMPORTANT: BDNYC and bdnyc are not the same thing.  Throughout this tutorial I use both BDNYC and bdnyc.  Make sure to keep track of which is which when using these commands.

Part 2: Create a dictionary that holds your data

The first thing you need to do is check whether the target is already in the database.  You do this by checking whether the u number exists in the database. (Inside the parentheses goes your u-number in single quotes. Ex. ‘U12140’):

>>> bdnyc.matchUNum(‘unum’)

If the target exists in the database, it will output the target index.  You will need this index when inputting the data. Continue reading

Beginning to find radial velocities for our NIRSPEC data

I’m (for the most part) finished entering our reduced NIRSPEC data into the database. Now I can begin to determine the radial velocities for these objects. In order to find radial velocities, you cross correlate your object’s spectrum with the spectrum of a calibrator whose radial velocity is known. The x-axis “shift” between the two spectra allows you to determine the radial velocity. I’m pretty sure there are a couple of things I need to do before cross-correlating to find the radial velocities (like applying a heliocentric velocity correction to account for our motion around the sun). But we already have a cross correlation code written by another member of our group, and so hopefully things will move pretty quickly from here!

Entering data into the database

This last week I’ve been getting familiar with our new python database by way of entering in the data I reduced last semester. So far I’ve input one night of data observed in September 2008 on the NIRSPEC spectrograph on Keck II. I have two more nights of data to input (11 or 12 objects), but it should go quickly!