BDNYC at AAS 225

BDNYC (and friends) are out in force for the 225th meeting of the American Astronomical Society!

Please come see our posters and talks (mostly on Monday). To whet your appetite, or if you missed them, here are some samplers:

Munazza Alam (Monday, 138.40)
High-Resolution Spectral Analysis of Red & Blue L Dwarfs
AAS225_Munazza_posterSara Camnasio (Monday, 138.39)
Multi-resolution Analysis of Red and Blue L Dwarfs
AAS225_Sara_poster
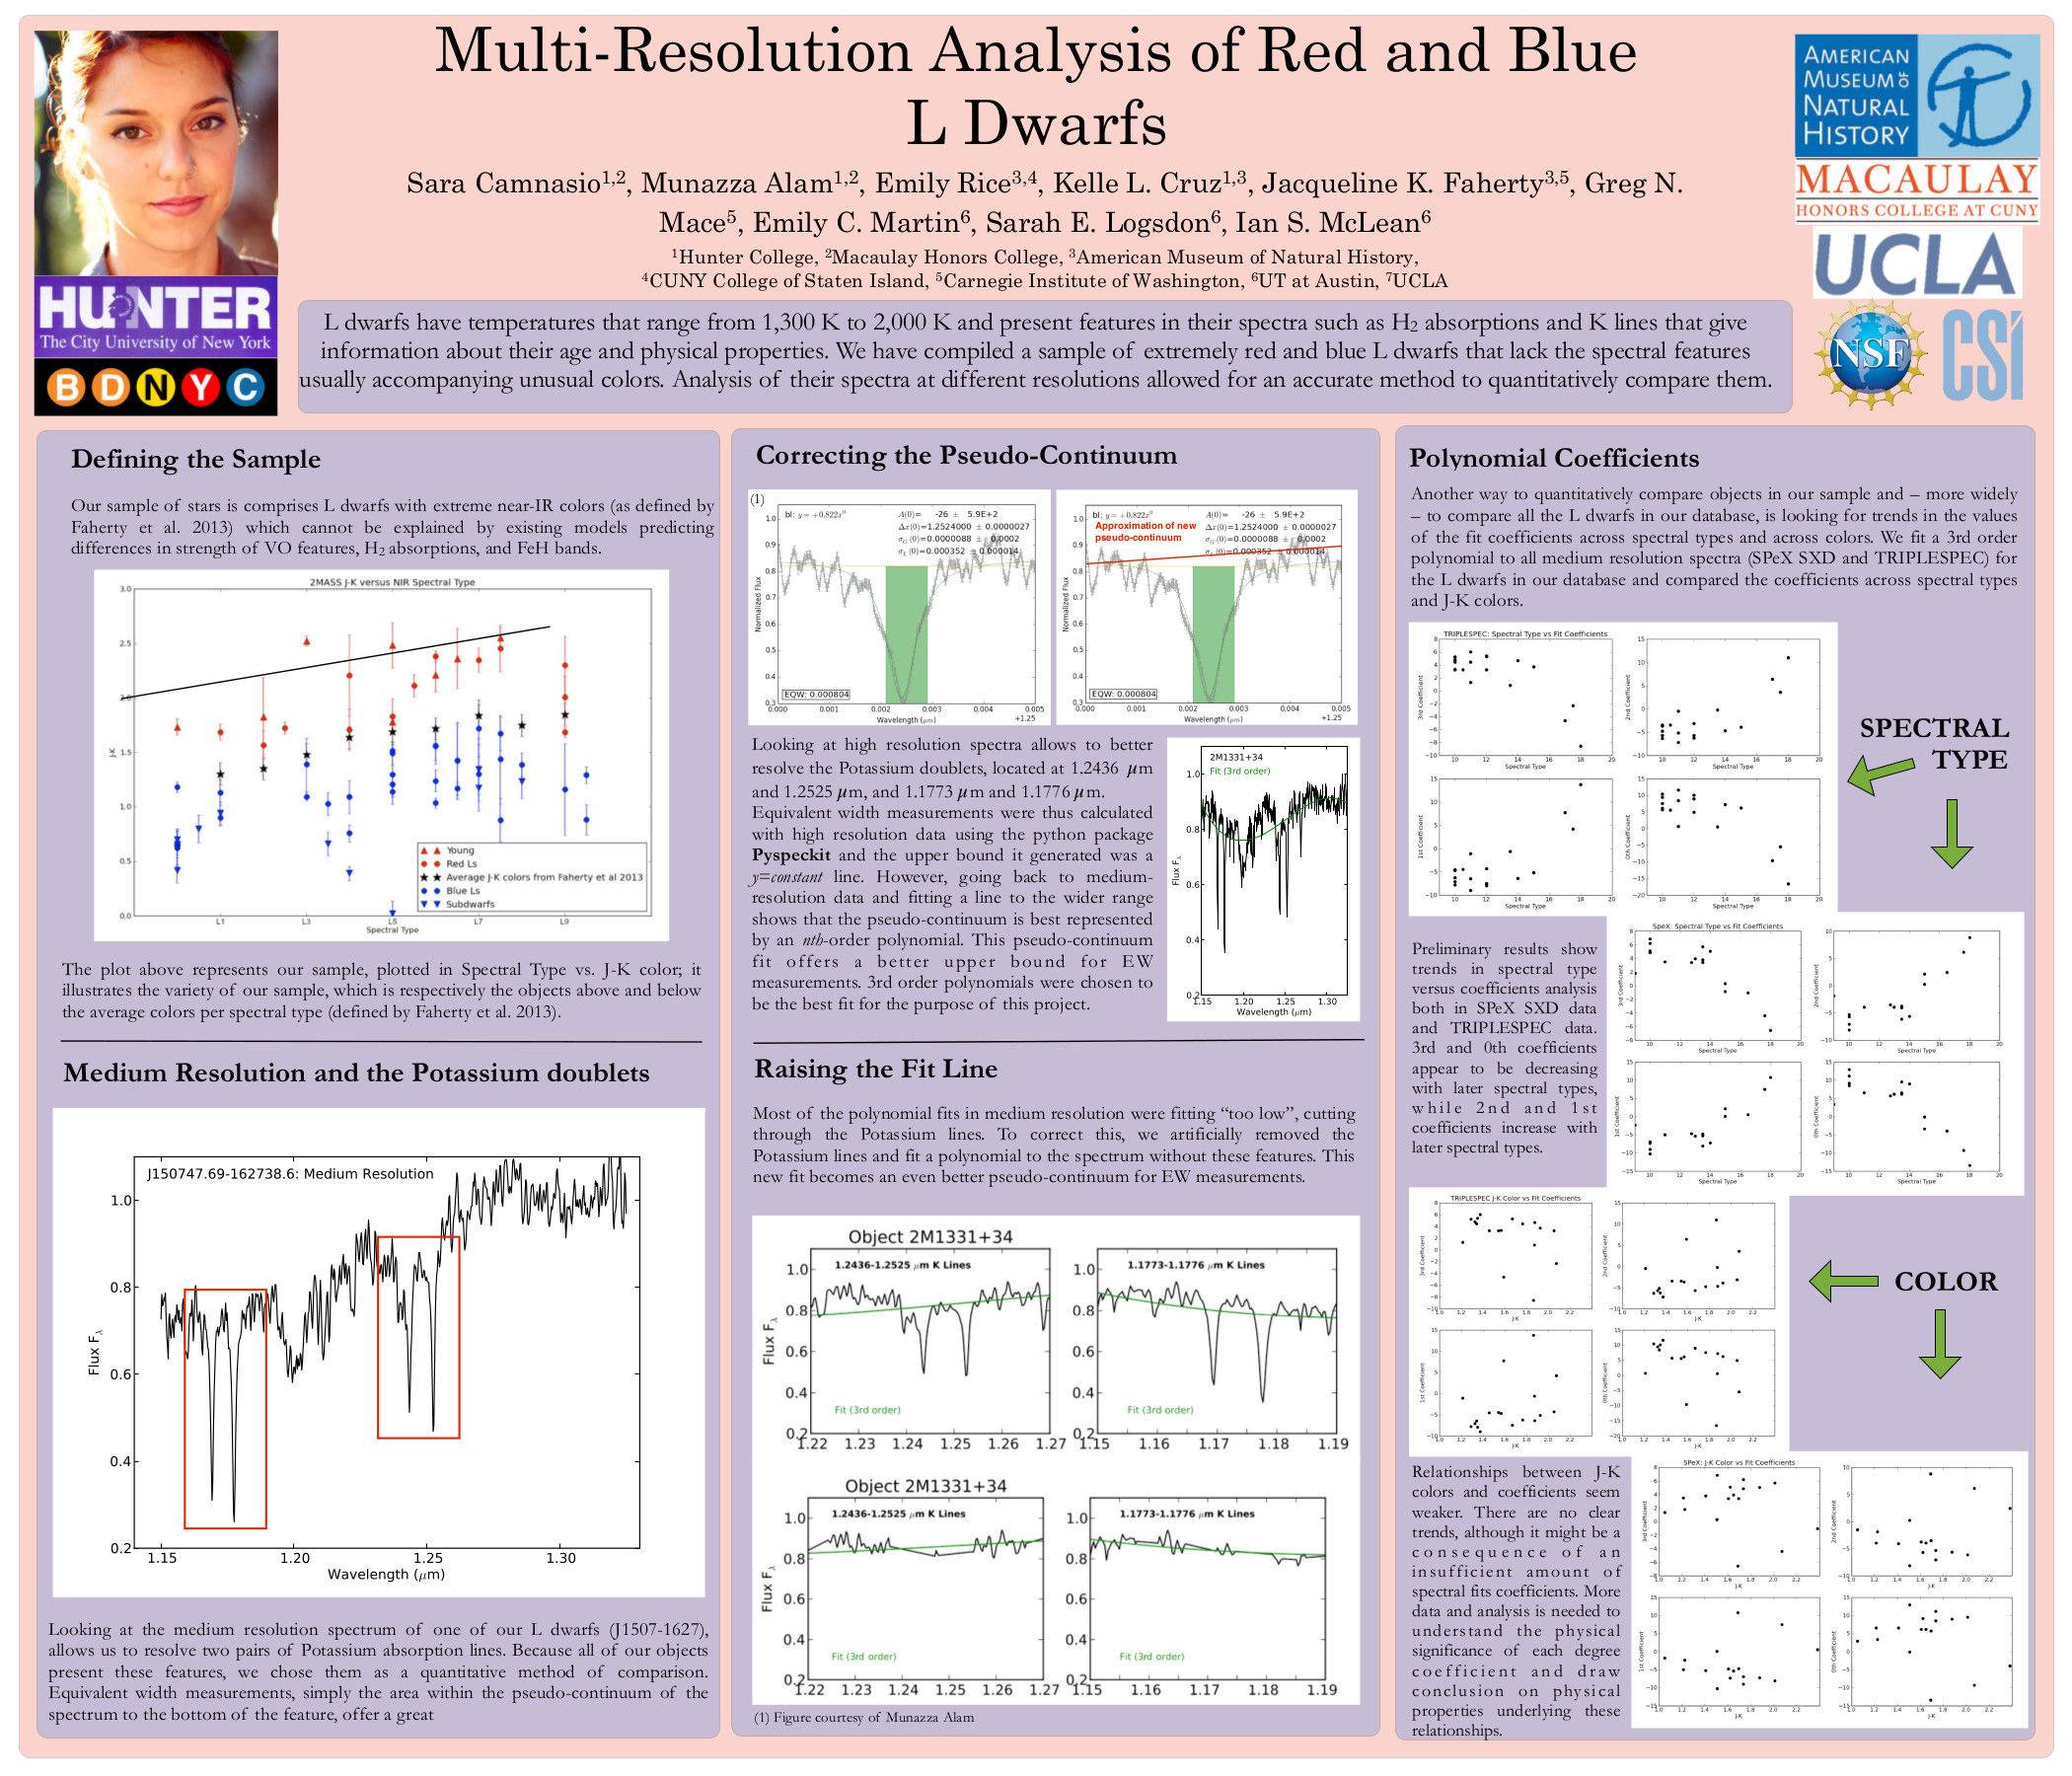
Kelle Cruz and Stephanie Douglas (Monday, 138.37)
When good fits go wrong: Untangling Physical Parameters of Warm Brown Dwarfs

AAS225_Stephanie_poster
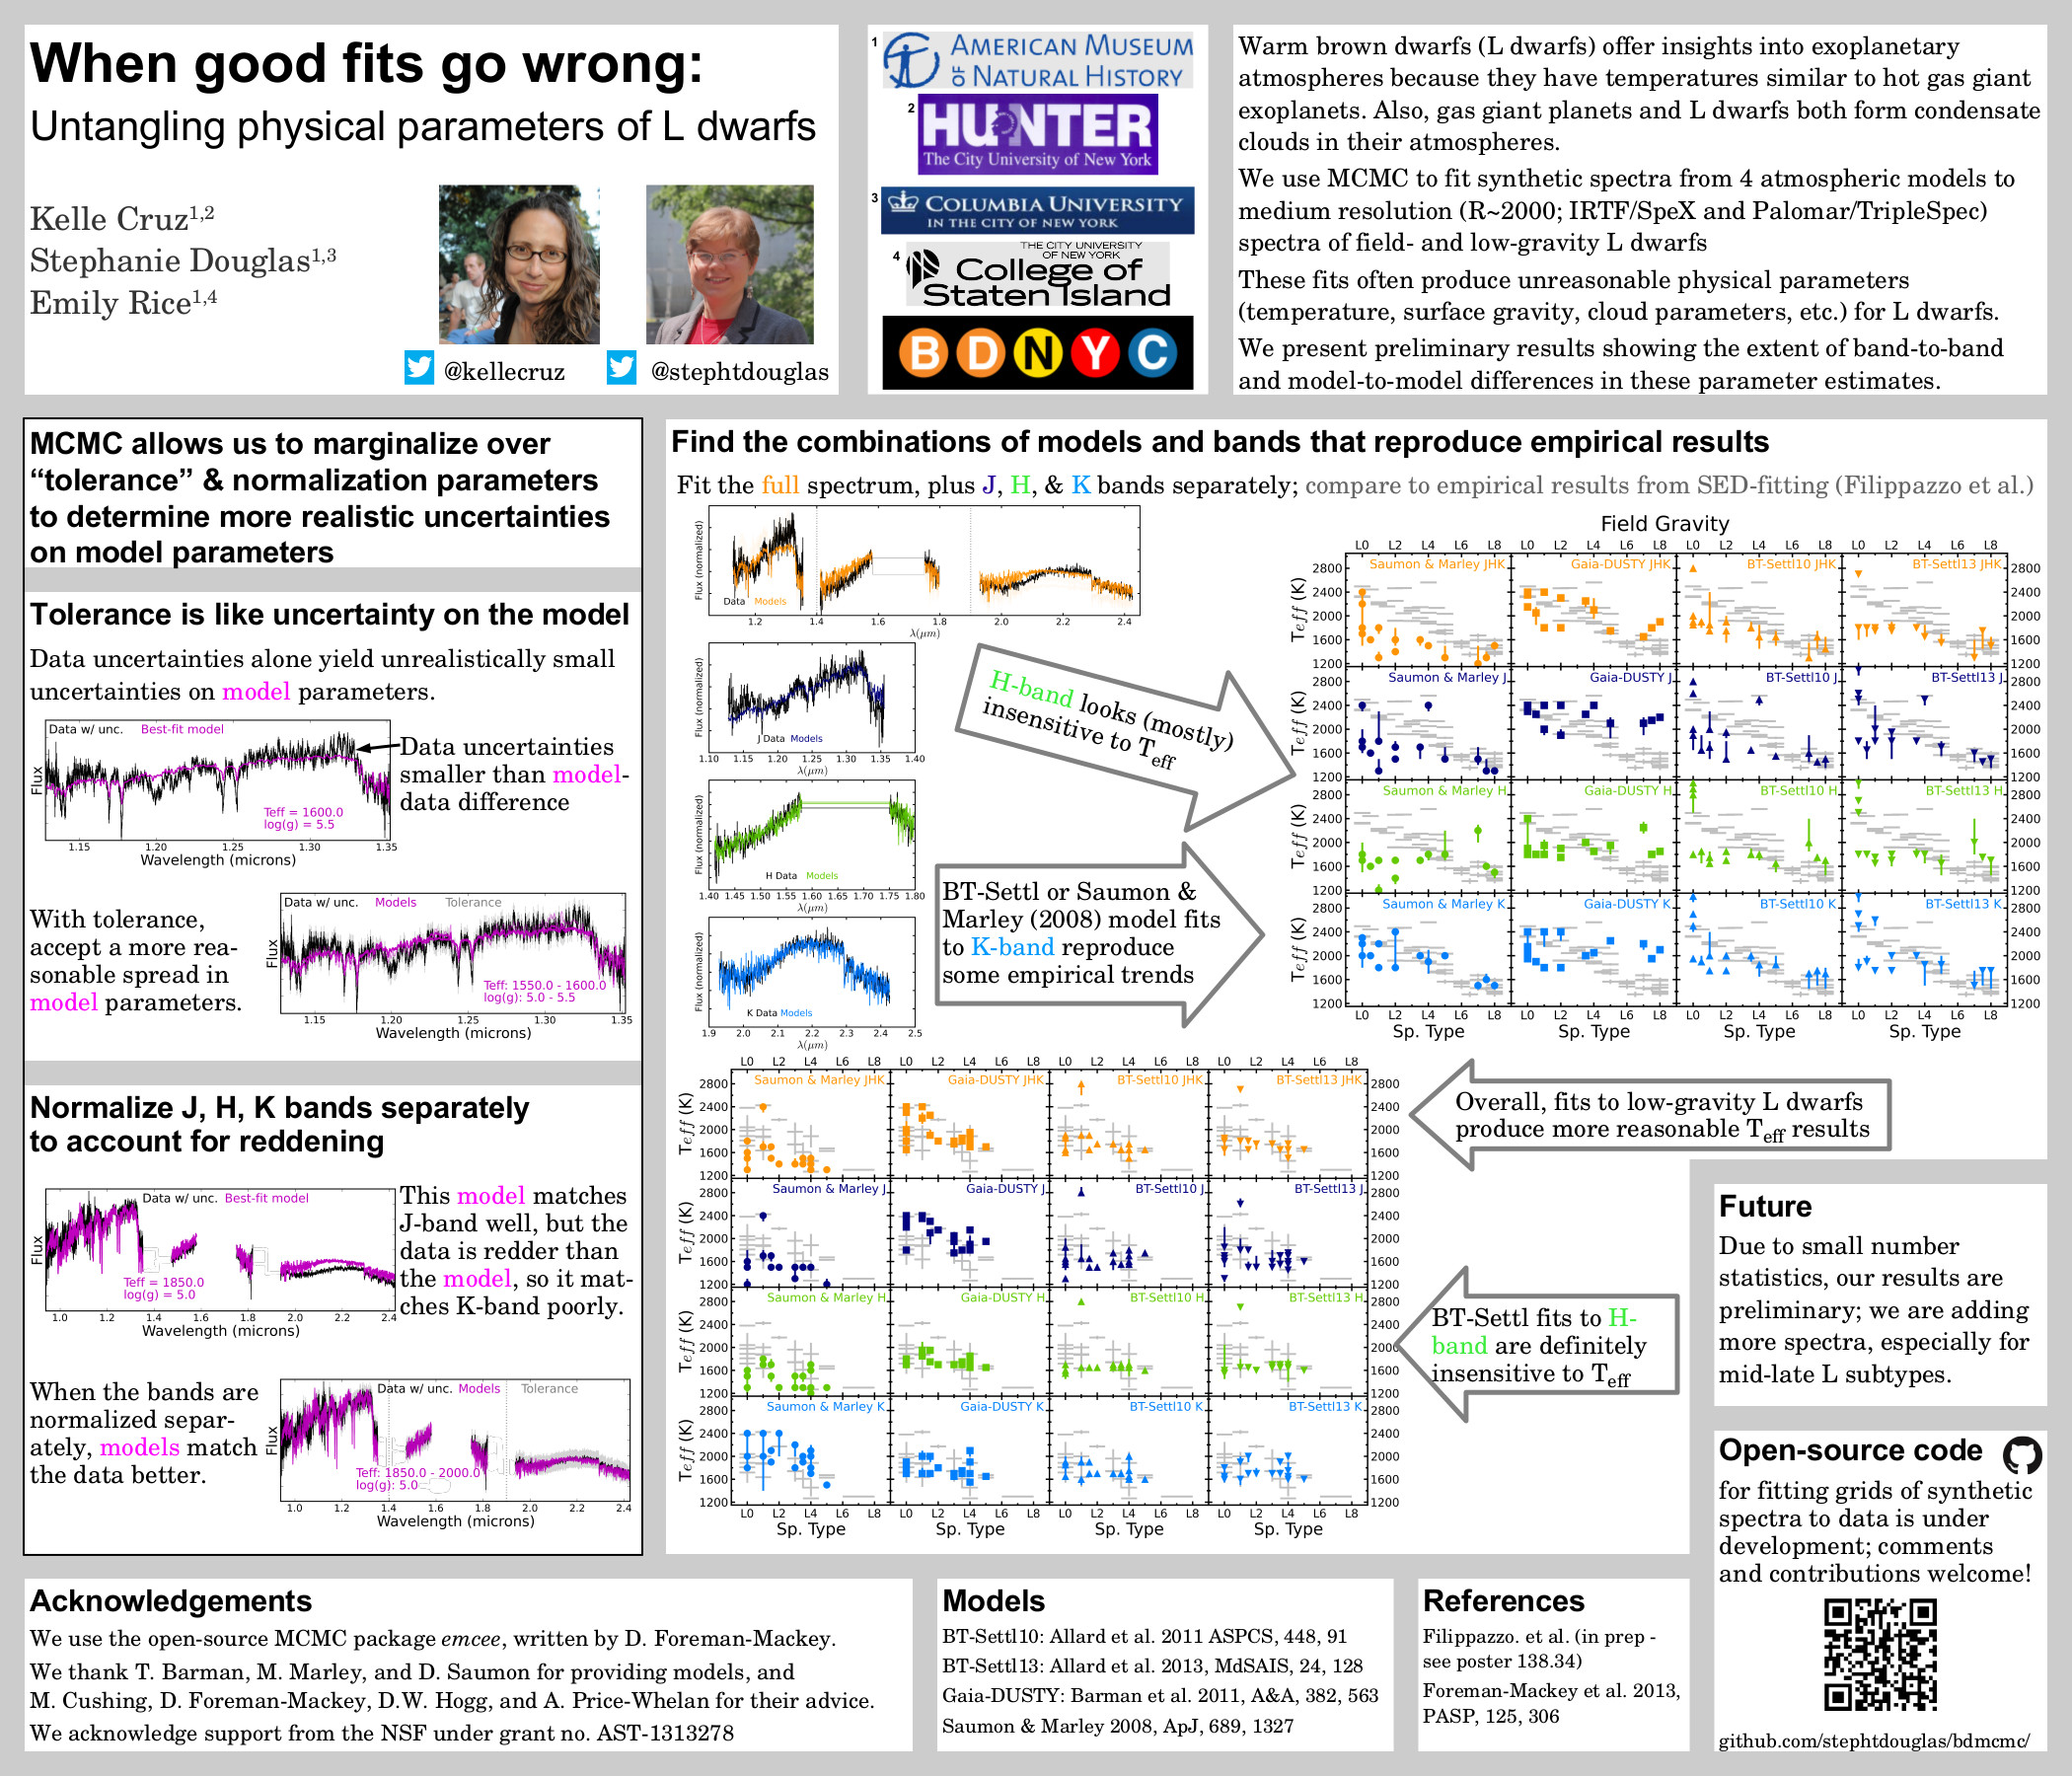
Stephanie Douglas (Monday 138.19)
Rotation and Activity in Praesepe and the Hyades

AAS225_Steph_poster2
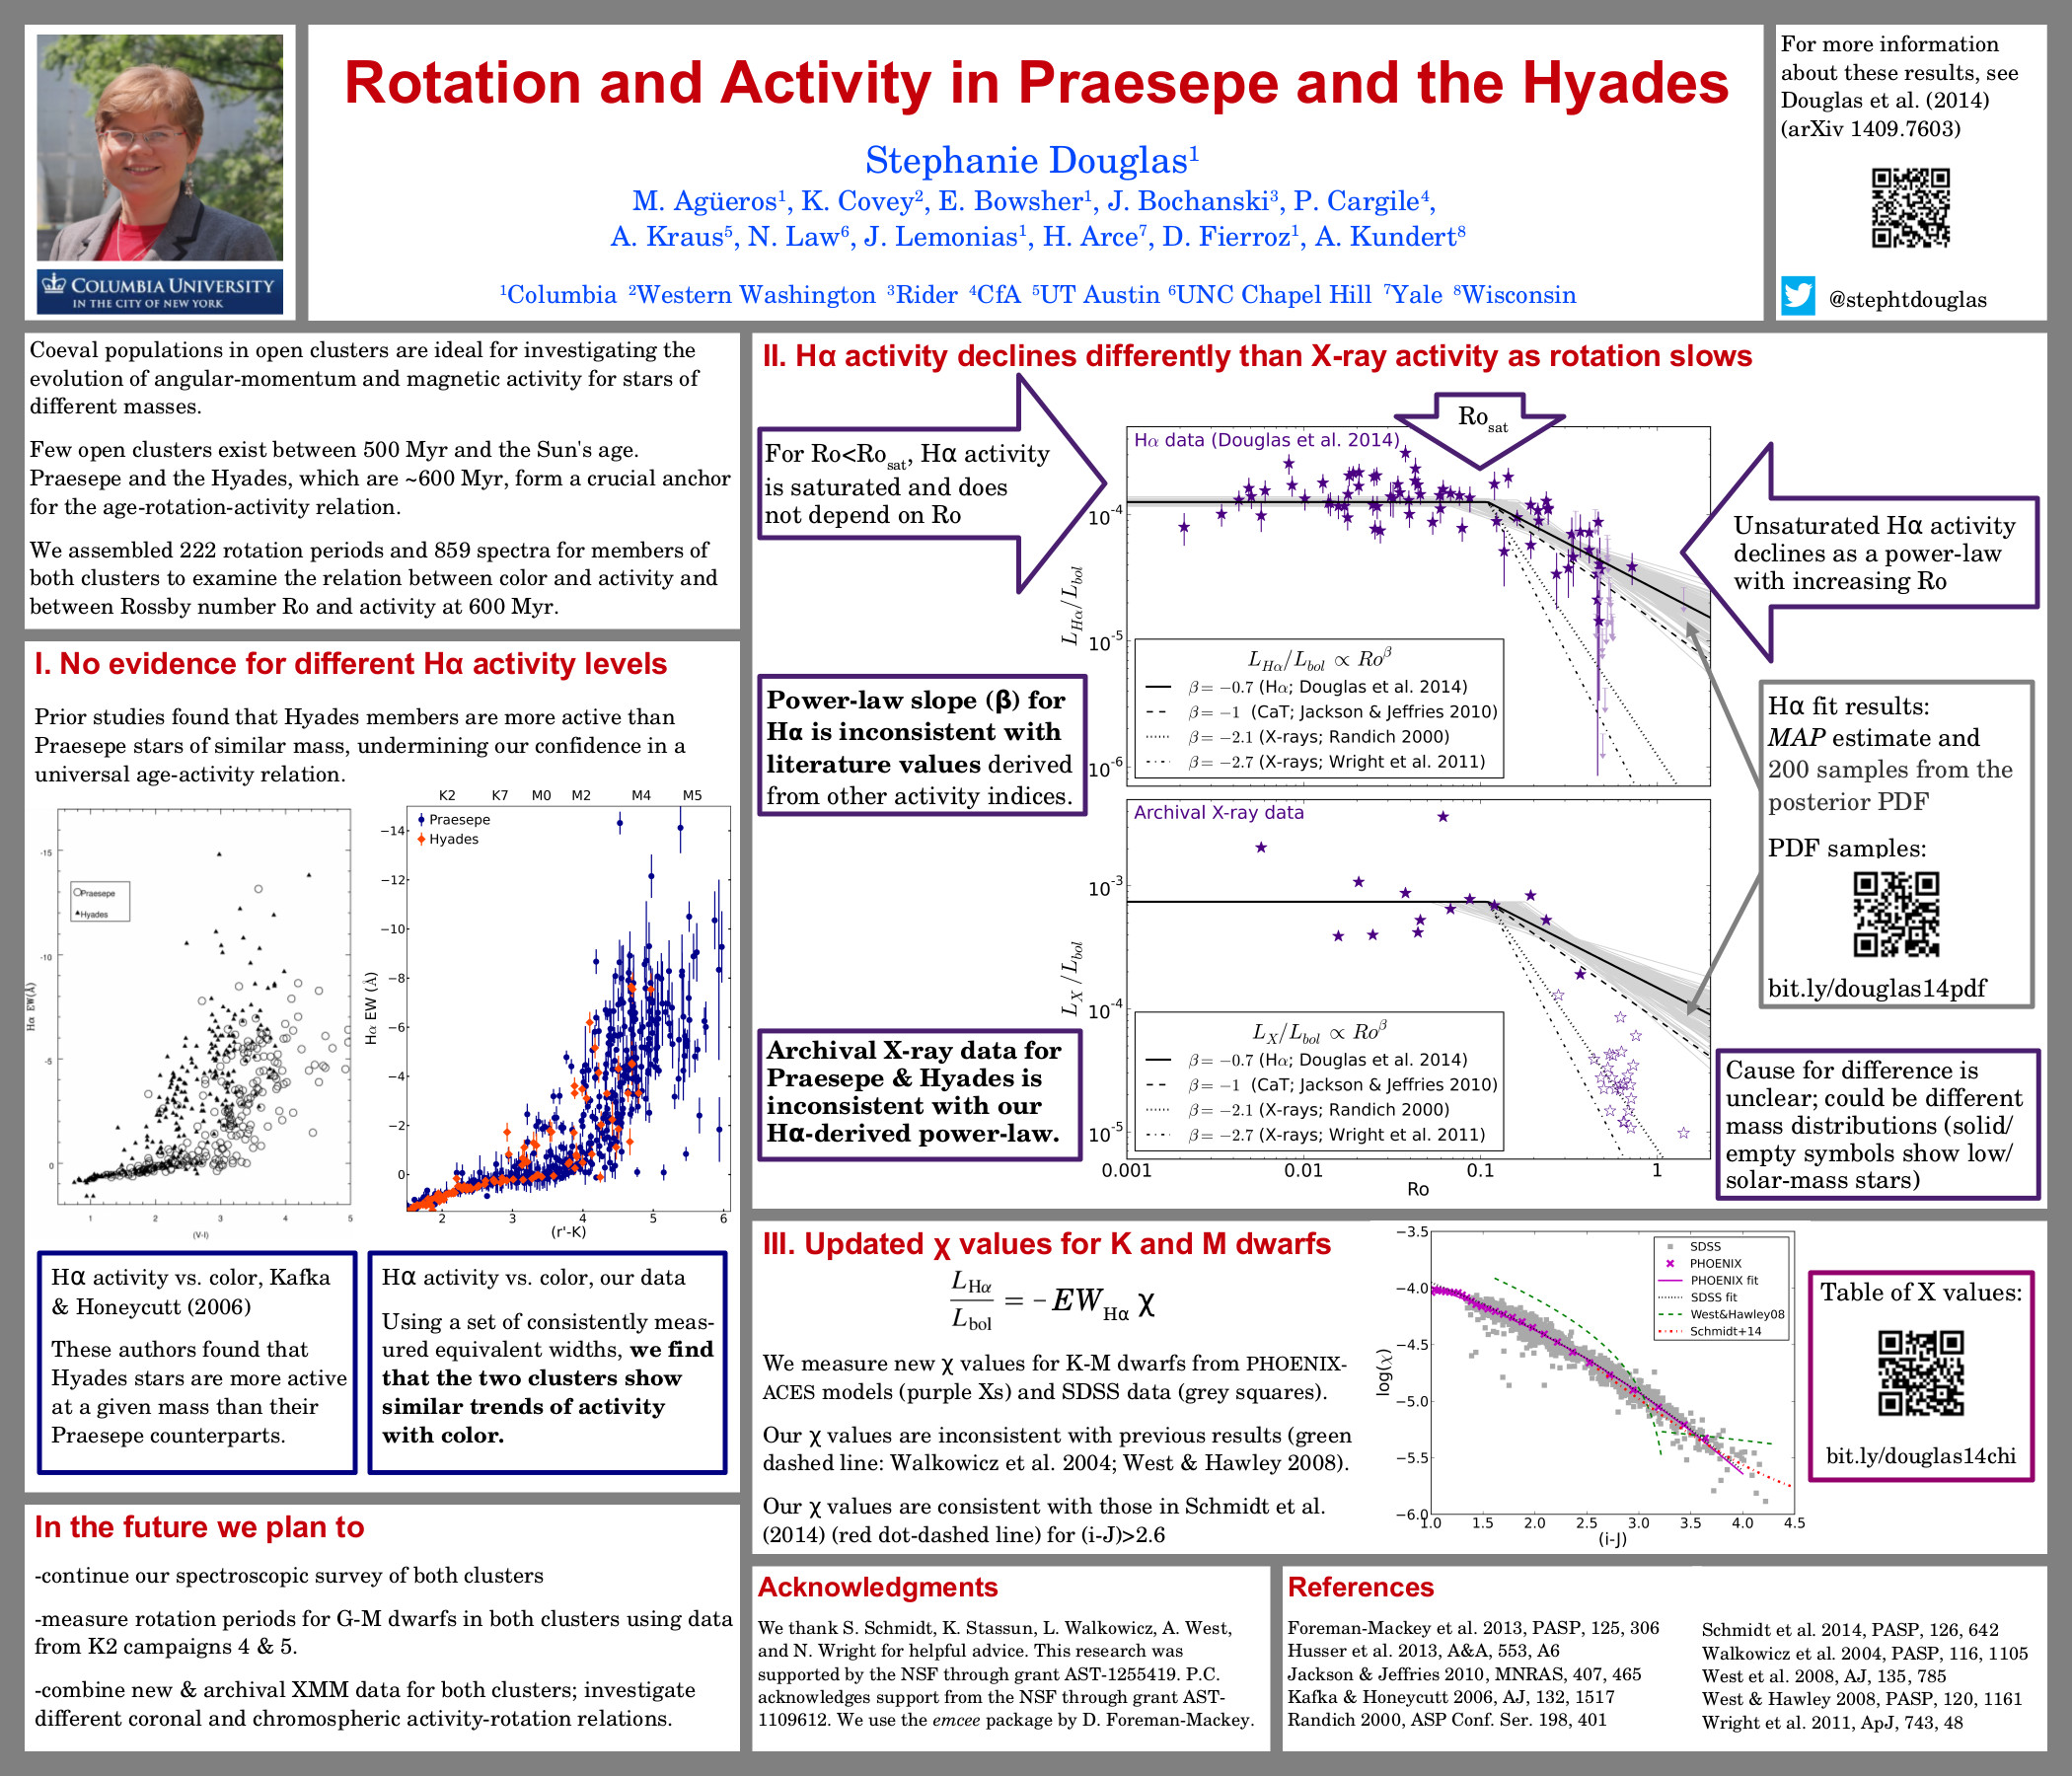
Jackie Faherty (Talk, Monday 130.05)
Clouds in the Coldest Brown Dwarfs

Joe Filippazzo (Monday, 138.34)
Fundamental Parameters for an Age Calibrated Sequence of the Lowest Mass Stars to the Highest Mass Planets
Joe Filippazzo - AAS225

Paige Giorla (Monday, 138.44)
T Dwarf Model Fits for Spectral Standards at Low Spectral Resolution
AAS225_Paige_poster
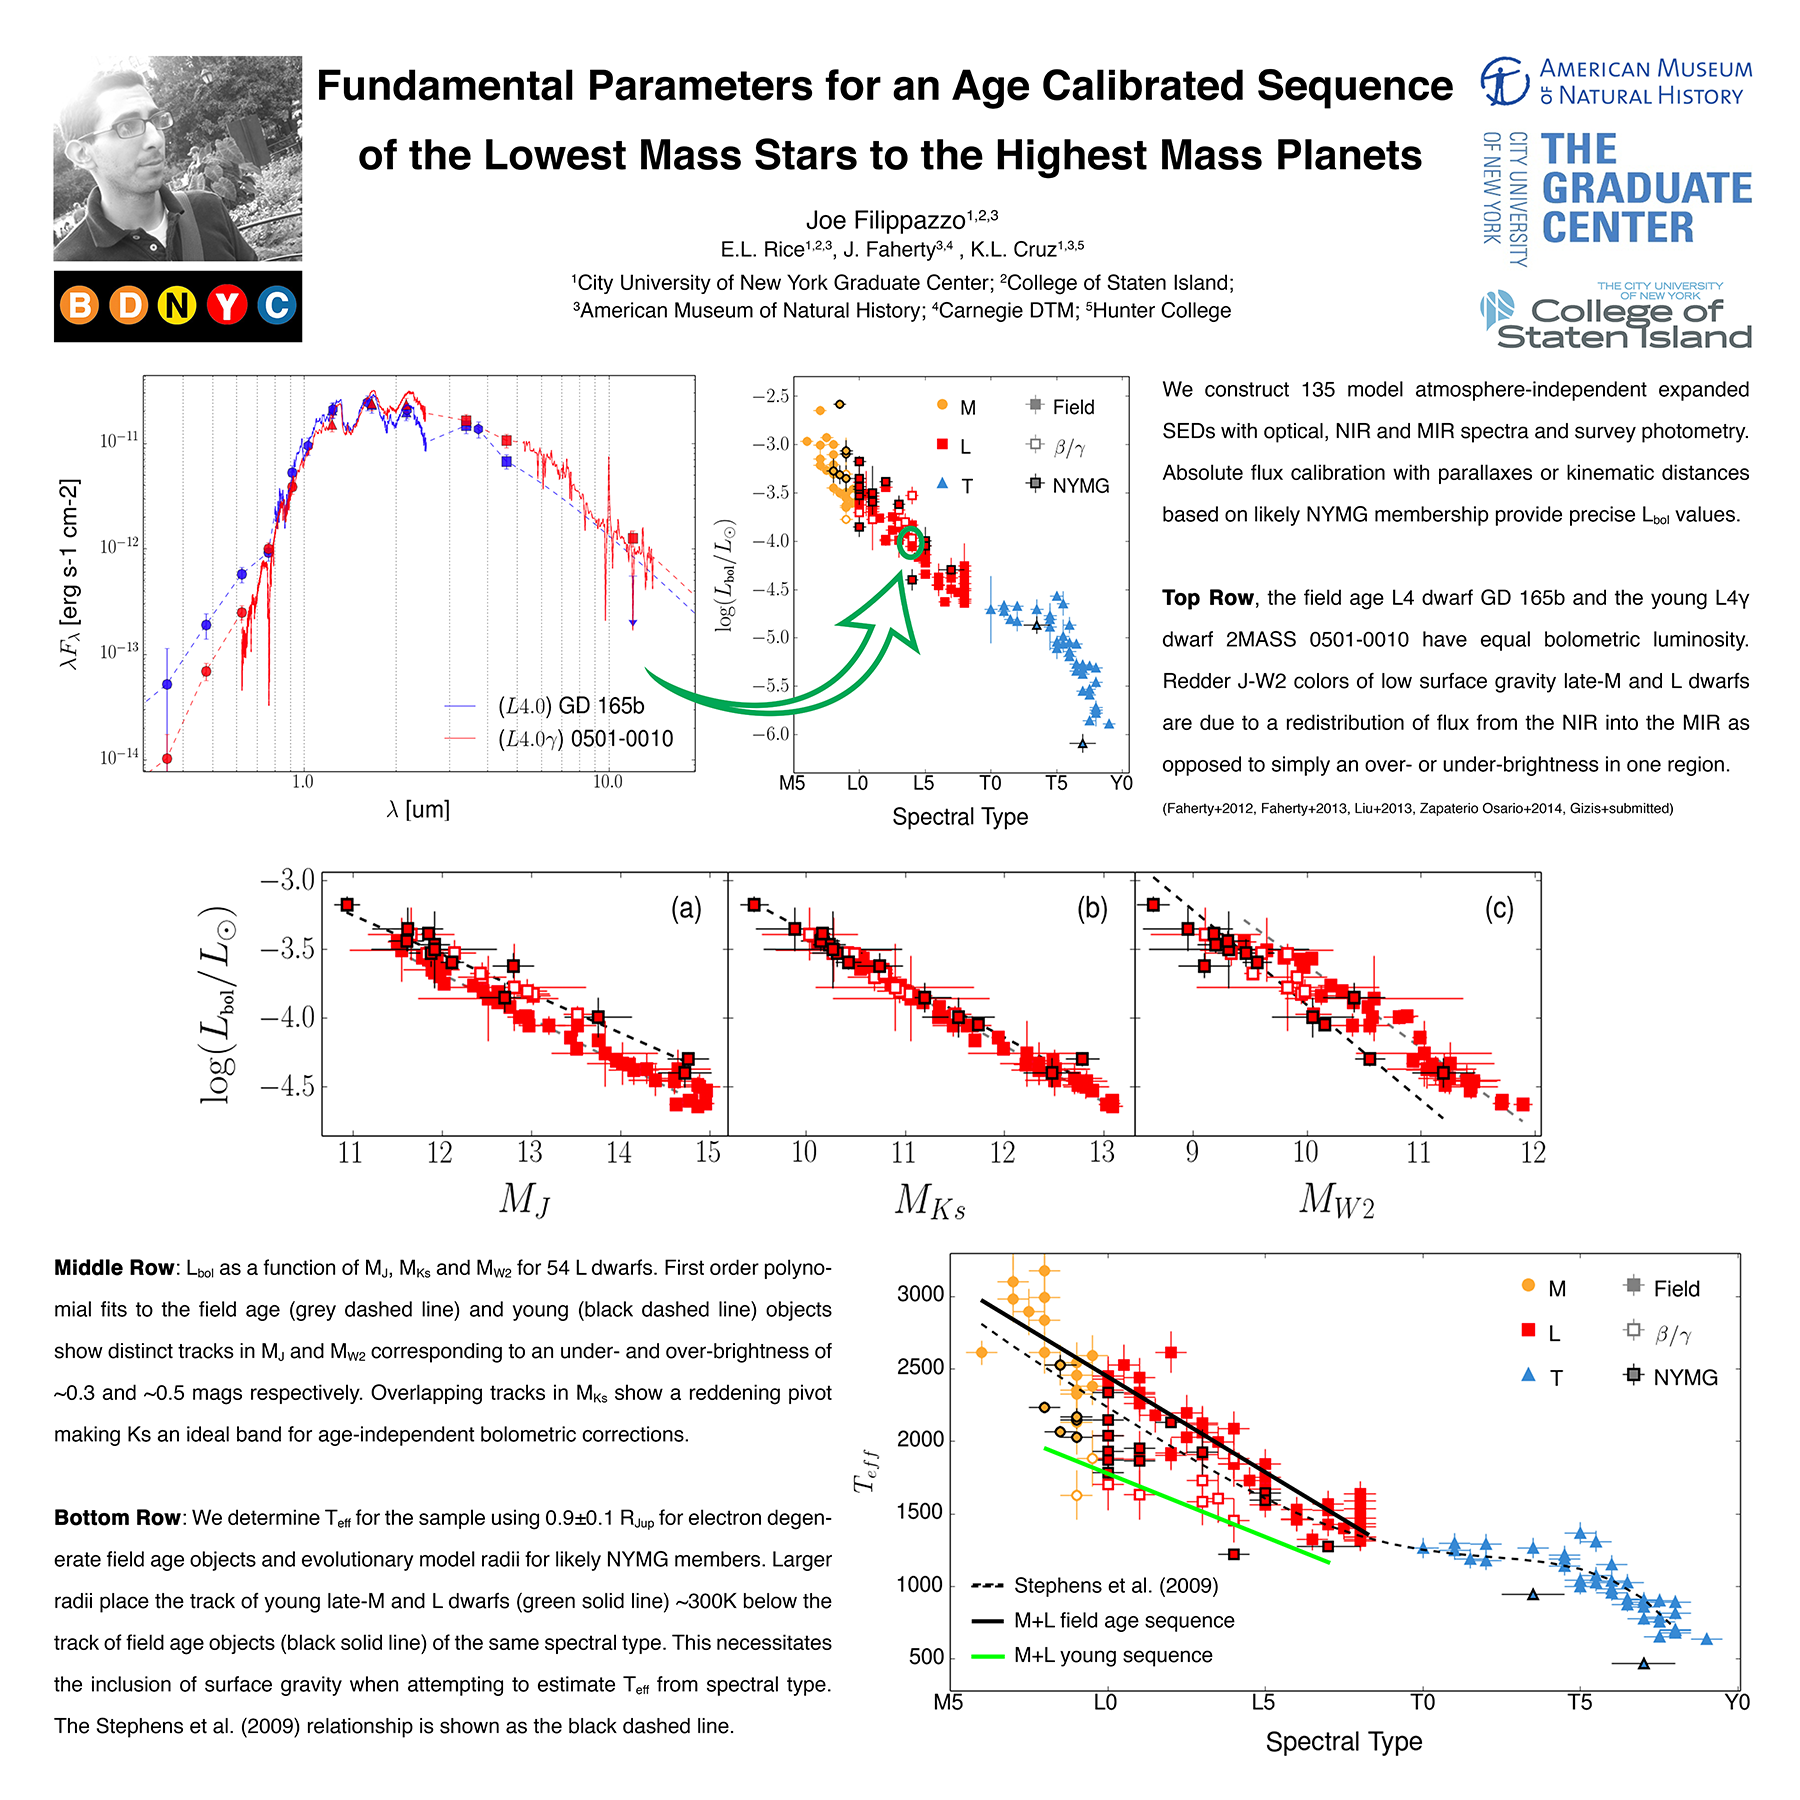
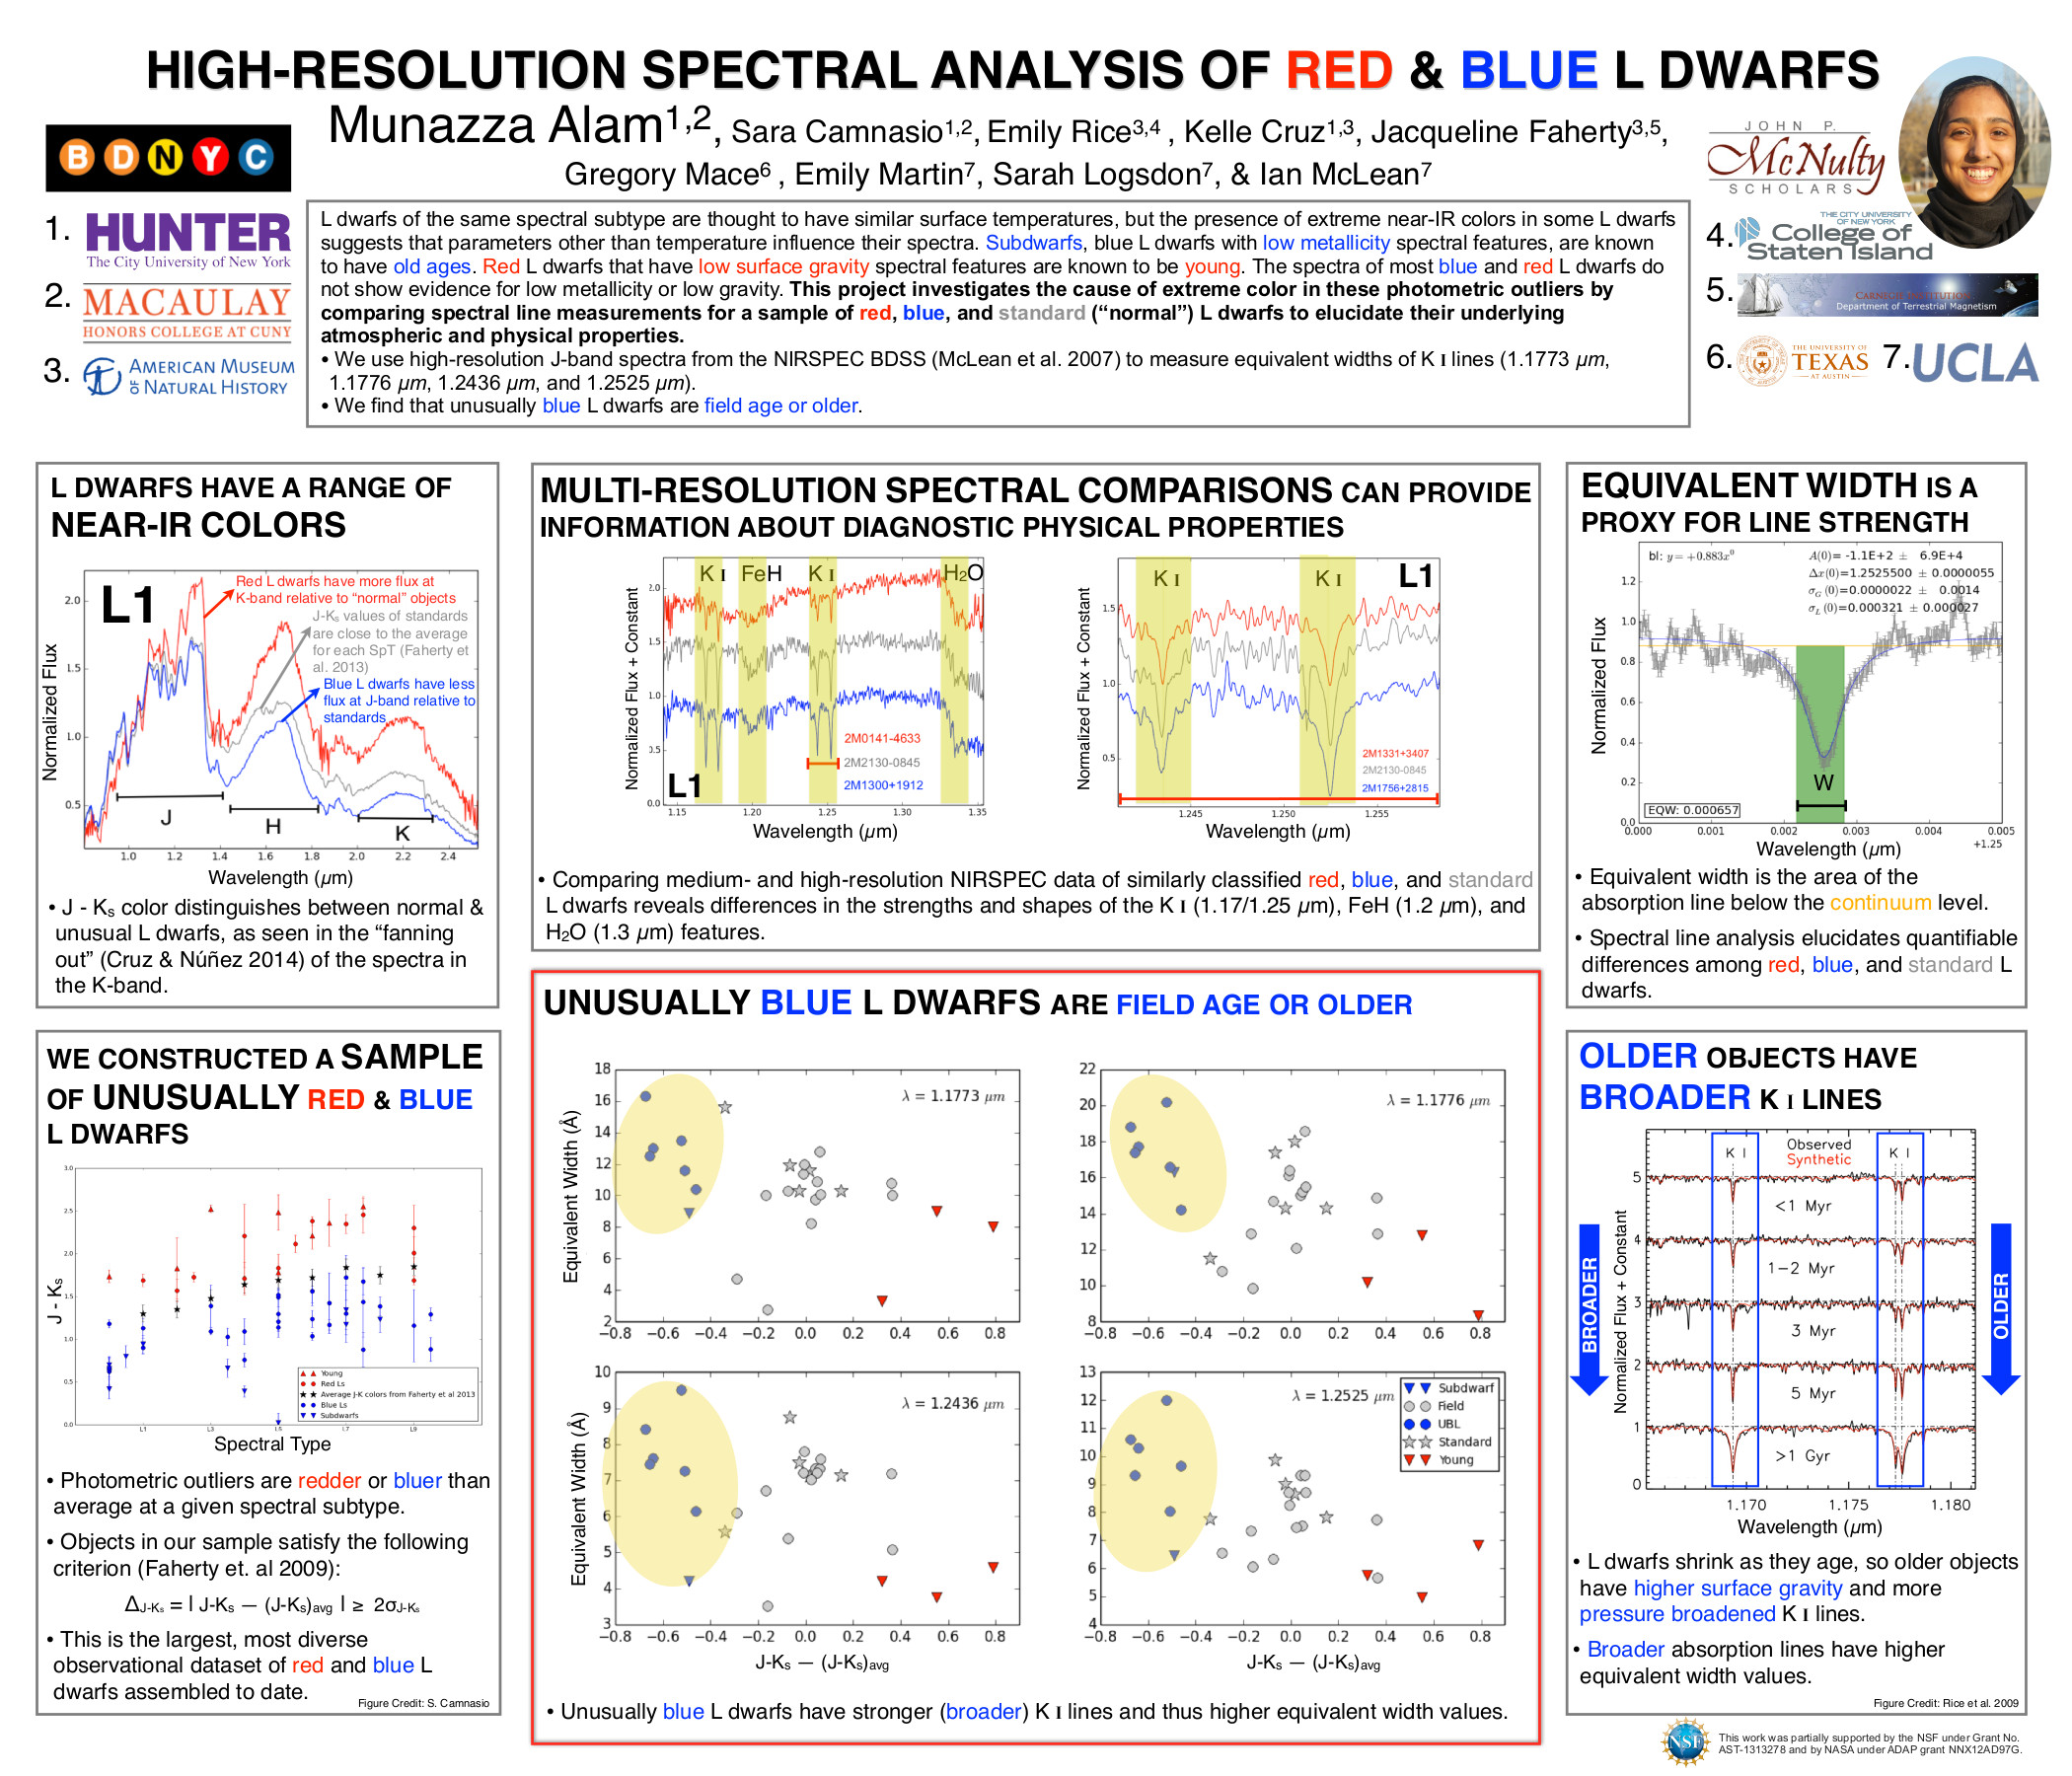
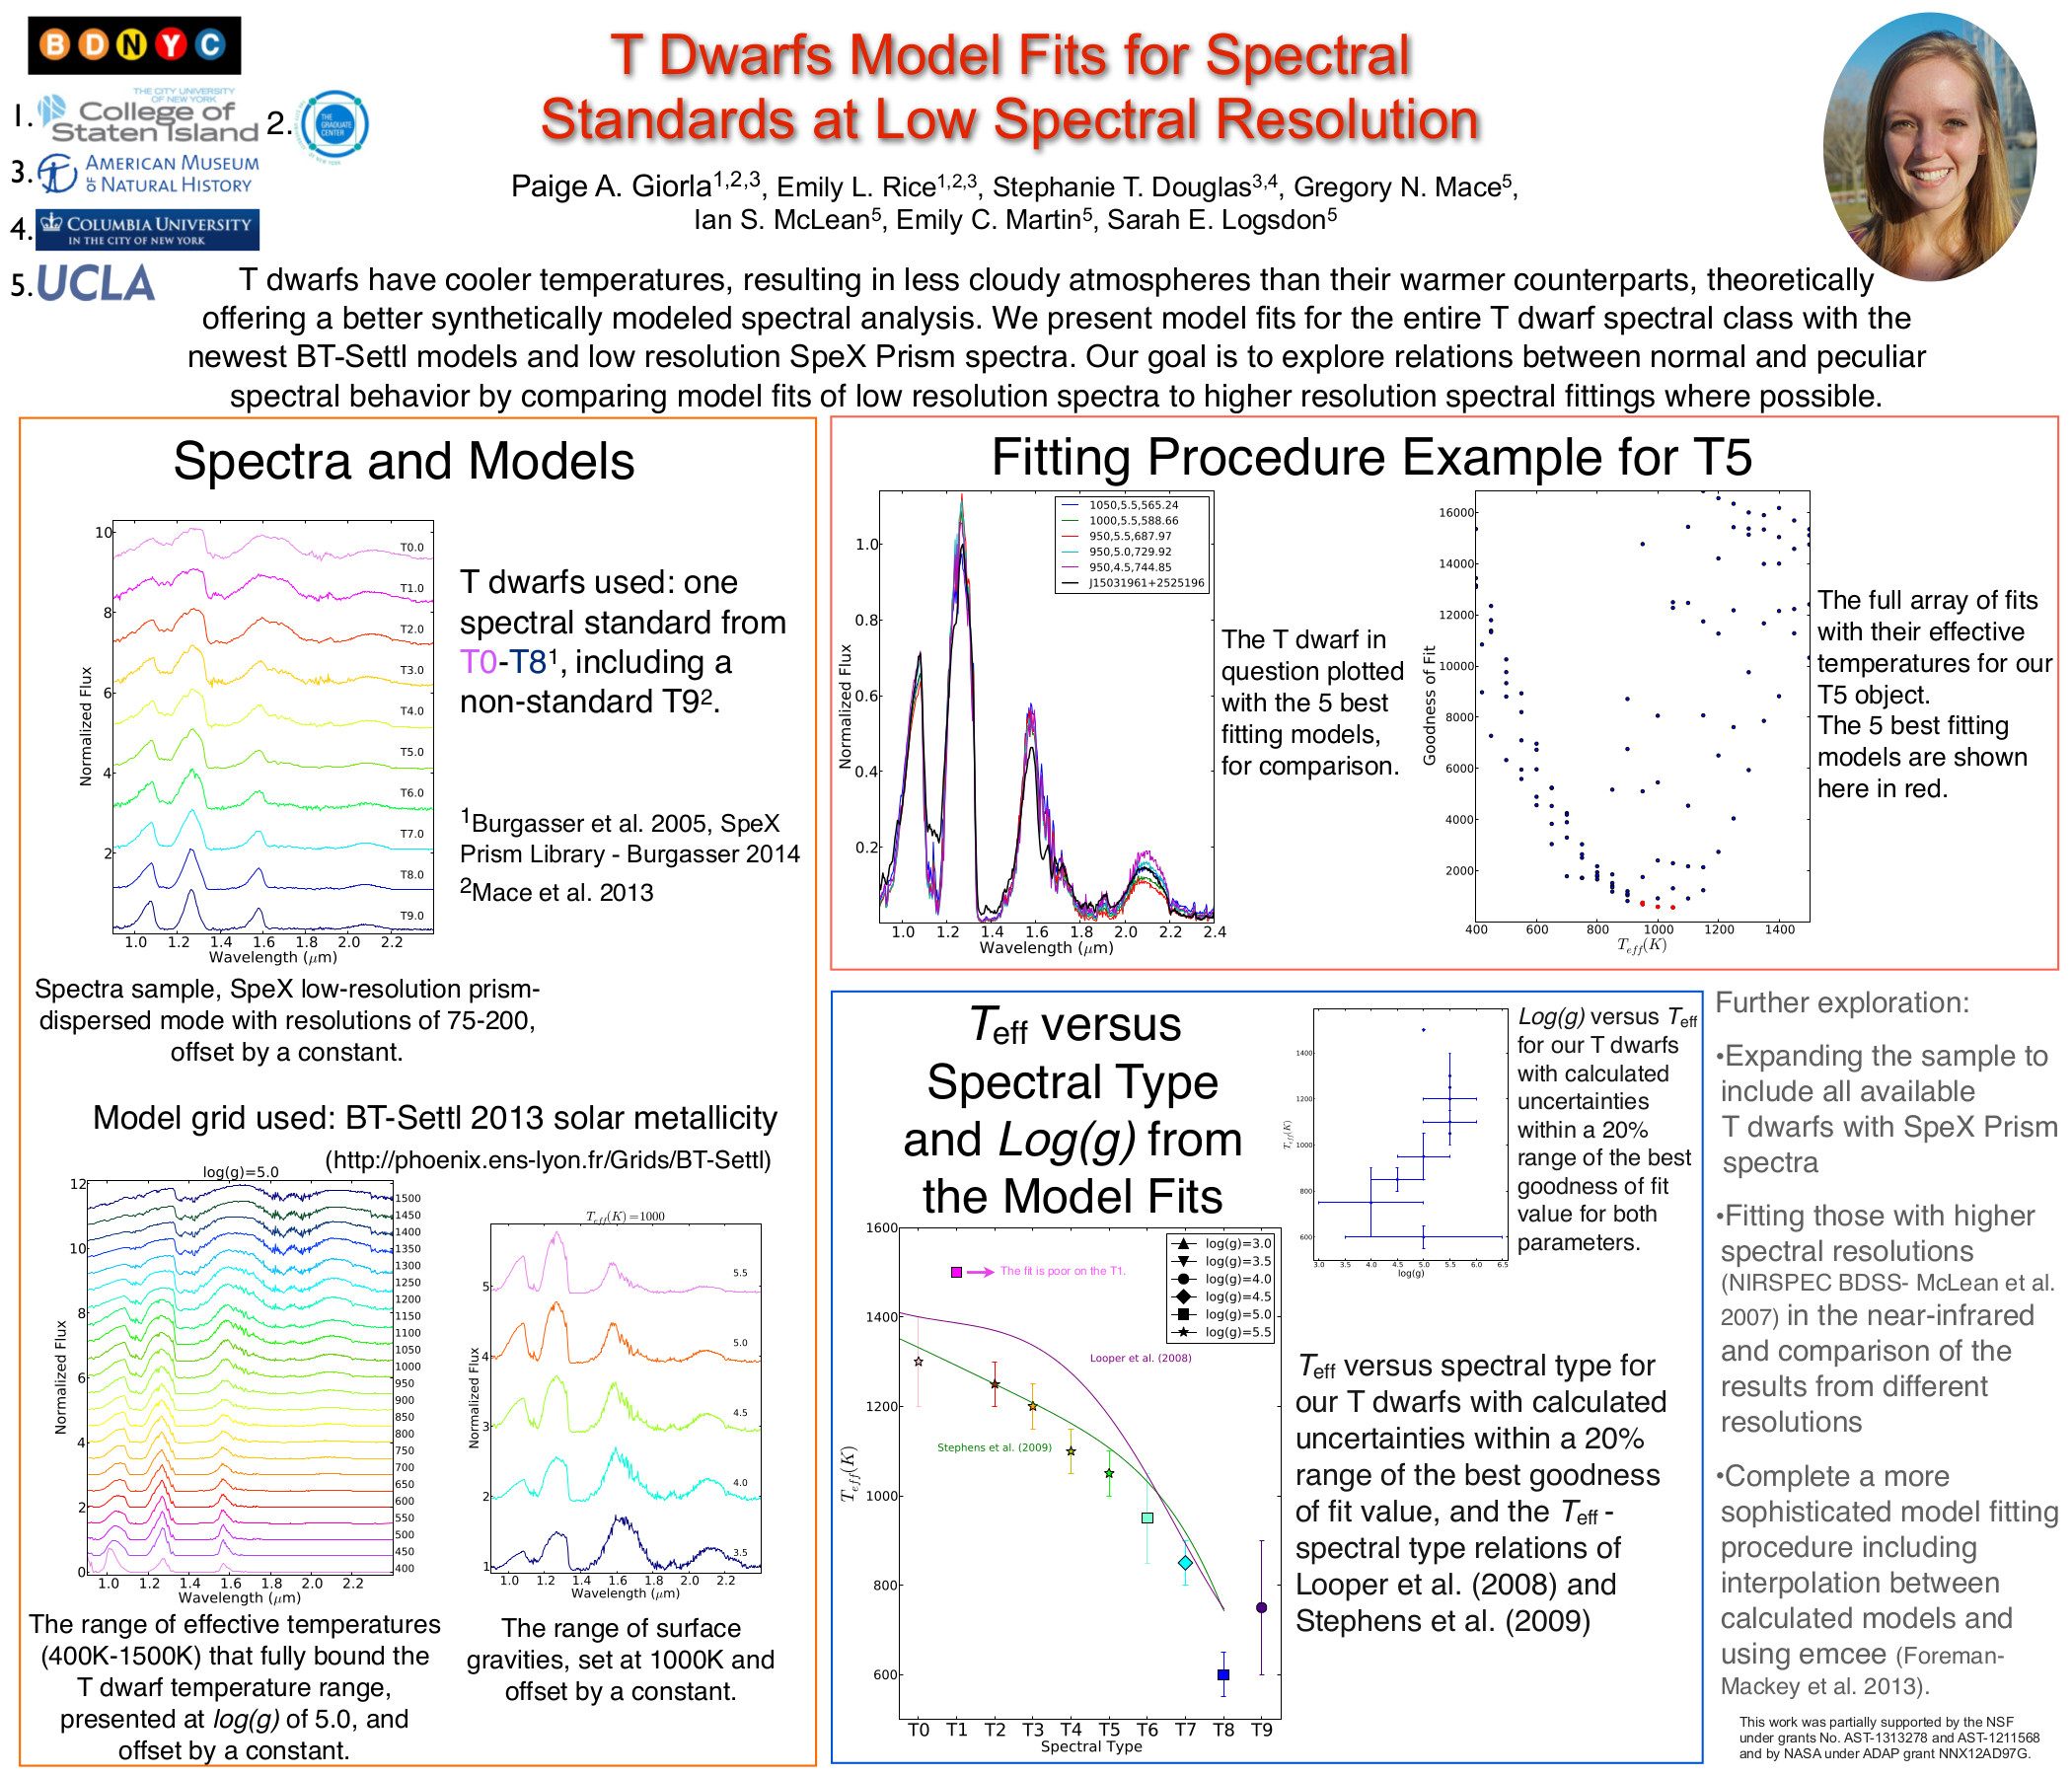
Kay Hiranaka (Talk, Monday 130.04D)
Constraining the Properties of the Dust Haze in the Atmospheres of Young Brown Dwarfs

Erini Lambrides (Thursday, 432.02)
Can 3000 IR spectra unveil the connection between AGN and the interstellar medium of their host galaxies?

Emily Rice (Tuesday, 243.02)
STARtorialist: Astronomy Outreach via Fashion, Sci-Fi, & Pop Culture
AAS225_STARtorialist
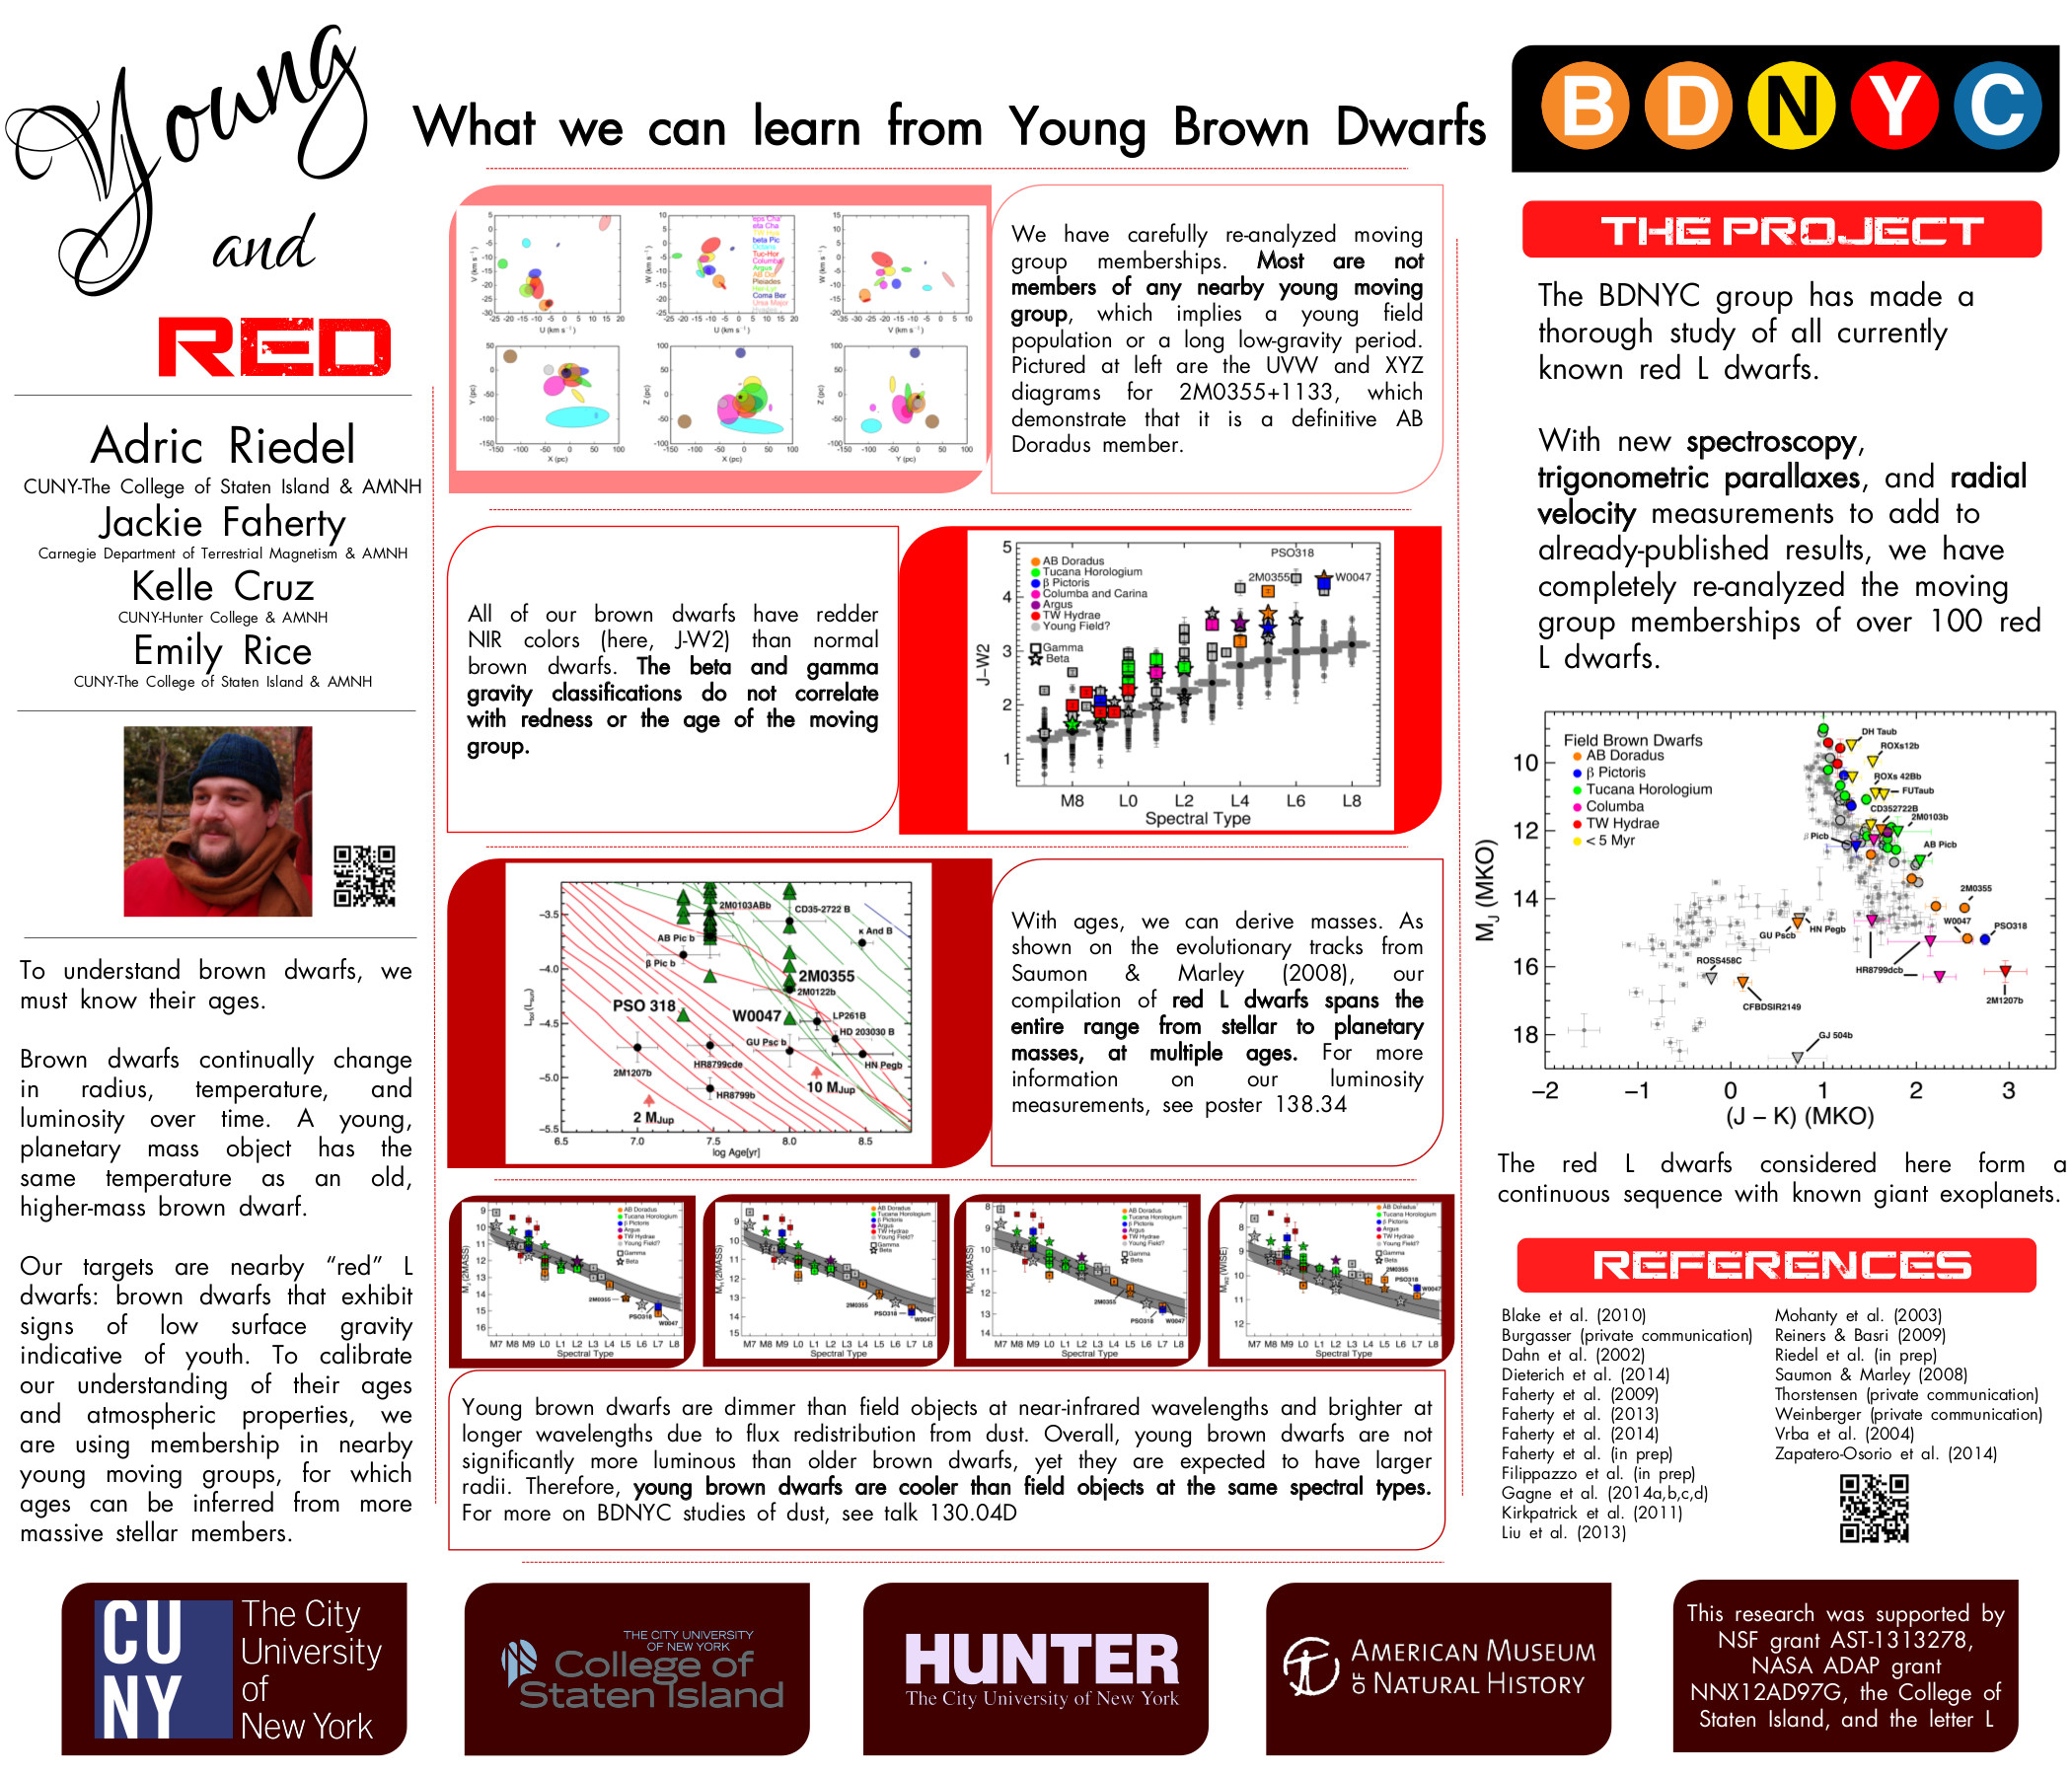
Adric Riedel (Monday, 138.38)
The Young and the Red: What we can learn from Young Brown Dwarfs
AAS225_Adric_poster

Using WriteLaTeX for Collaborative Papers

Update: WriteLaTeX is now Overleaf

We all love Google Docs. It’s a functional and convenient way to share and collaboratively edit documents across platforms, time zones, and even continents. We in the BDNYC group use it extensively.

But what if you want to write a scientific paper? Google Docs, as awesome as it is, is not much more than a word processor. We want the internal hyperlinks for sections, figures, tables, and citations, elegant mathematical formulae, well-formatted tables, more control over where and how our components are arranged – in a word, LaTeX. Yes, LaTeX has its own host of problems, but it’s very good at what it does.

There are a number of collaborative editing projects out there – Authorea springs to mind. But one of the simpler options out there is actually pretty good: WriteLaTeX.
Continue reading

Using astroquery

If you’re like me, you’ve spent a lot of time downloading a table from VizieR, and then trying to insert it into whatever database or table you are currently using. It’s annoying, particularly because VizieR either won’t output information in a machine-readable format or won’t put an empty line into a massive list of results when there’s no match in the catalog.
Astroquery is better. It’s a python package affiliated with astropy that can grab data from all your favorite catalog servers (Vizier, SIMBAD, IRSA, NED, etc) directly, and use it; combine that with Astropy’s ability (or Python’s capacity) to print out tables to files, and it’s a lot easier to write a script to do it all for you.

Astroquery is in the Python Package Index, so you can install and update it with
pip install astroquery

You also need the ‘requests’ module to do the web-interfacing (and Astropy v3); it’s available on the Python Package Index and comes preloaded in Anaconda. Using it is simple (this part is almost entirely taken from their pages on using VizieR and IRSA):
Continue reading

Memory Leaks in Python

I just spent a few hours tracking down a massive memory leak in the Python code I’m working on for my current project.  Running the code on even a single object would eat up 4 GB of memory in my computer, and that slowed the entire system down to the point that other programs were unusable, even if they didn’t crash outright.  After fixing the memory leak, the memory usage stayed between 200-204 MB for the entire time the program was running.

As it turns out, the problem was that every loop was creating several plots, and (even though I was writing them to files) not closing them with a plt.clf() except after the end of the loop, which only affected the last plot object.

The gist of it is, there are only a few reasons for memory leaks in Python.

  1. There’s some object you are opening (repeatedly) but not closing.
  2. You are repeatedly adding data to a list/dict and not removing the old data. (for instance, if you’re appending data to an array instead of replacing the array)
  3. There’s a memory leak in one of the libraries you’re calling. (unlikely)

source: http://www.lshift.net/blog/2008/11/14/tracing-python-memory-leaks

I haven’t successfully tried the methods listed in the above link (they seem to be for heavier-duty programming than we use) but that first reason is likely to be a problem for BDNYC:  We open plot figures, we open the BDNYC database, we open .fits files with astropy… remember to close things properly.

For the record, this seems to be the correct sequence for making a matplotlib plot:

fig = pyplot.figure(1)
ax = fig.add_subplot(111) # or fig.add_axes()
ax.plot(<blah>)
ax.set_xlabel(<label>)
(...)
fig.savefig(<filename>)
fig.clf()
pyplot.close()

That last line was completely new to me, but is apparently necessary if you do it this way.  Matplotlib works without creating a figure, adding axes to a figure, and then adding plot commands to the axis… but if used this way, you can actually edit multiple figures and their subplots at the same time — just specify which axis variable you want to add the plot element to. To my knowledge, this is a clear advantage over IDL: IDL can only operate on one plot at a time; trying to open a new one closes the old one.

Identifying Nearby Young Stars, Part 2: The Convergence Point

The one sure thing about a moving group is that all the stars are supposed to be moving together through space.
Even without full 3D kinematics, we can still see this: The Pleiades cluster and Hyades cluster members all have similar proper motion position angles: 160 for the Pleiades, 110 for the Hyades (both in the system where due North is 0, and due East is 90). In fact, the Ursa Major moving group (composed of most of the stars in the Big Dipper) was initially found this way.

That only works well with clusters, though. If you have a moving group or young association that’s spread out over large regions of sky, the directions the members are moving in will change:

Young star proper motions

A plot of the proper motion vectors (scaled up 180,000 times) of young stars in Zuckerman & Song (2004) and Torres et al. (2008) color-coded by association (see Part 1, or later on in this post for the key). The + sign is the Solar Point (the Sun is basically moving toward that point), and the X is the Anti-Solar point, which the Sun is moving away from.

There’s still a pattern here, though; compare it to a plot of the basically random positions of ALL 2130 star systems within 25 pc (81.3 ly) of the Sun:

Nearby star Proper Motions

Same as above, now with all star systems within 25 parsecs (81.3 light years). In general, motions are random and faster. There are some young stars within 25 pc, these are still color-coded.

Still, while the proper motions of stars in associations may differ, they WILL, however, converge at a particular point on the sky called (appropriately) the ‘Convergent Point’. The convergent point is exactly analogous to the vanishing point we’re familiar with when we see a road or a train track vanishing off into the distance. Here, however, instead of parallel rails, we have a collection of stars moving along parallel paths. All the stars seem to be COMING from one point, and GOING TO another point.

To see the convergent point, I extend the proper motion vectors of the nearby young stars mentioned in Zuckerman & Song (2004) and Torres et al. (2008) into great circles (lines of circumference around a sphere). The result is shown below:
Great Circles for all young stars
I can break this down, though, into a series of group-by-group plots:
Convergence Points for Associations
Some observations:

  • The fact that all the young association convergence points are near the Anti-Solar Point (the X; examine the shorter vector plot to see which direction they’re heading) implies that it’s really the Sun doing most of the moving; the associations are “disappearing behind us” as we pass them. The associations do have some small differences in velocity relative to each other, and that accounts for their convergence points being slightly offset from the Anti-Solar Point.
  • It’s no accident that 2MASS J06085283-2753583 (Rice et al. 2010) and 2MASS J06131330-2742054 (Malo et al. 2013) have extremely low proper motions; they are sitting almost on top of the Beta Pic convergence point, so their motions should be entirely in the line of sight, and pointed away from us.
  • Some of the stars in Tuc-Hor (and others, too) do NOT converge with the rest of them; they may not actually be members.  Or my proper motion is wrong.
  • I have no proper motions for some stars in Beta Pic and TW Hya, hence no great circles for them.
  • The Octans association itself does not really converge. I would not be the first person to suggest that Octans is not a real association.

Identifying Nearby Young Stars, Part 1: Young Star Isochrones

As stars form, their position on the HR diagram (or, equivalently, a Color-Magnitude diagram) changes.   They start out very cool but physically very large and very bright; as they collapse under gravity and become fully supported by hydrogen fusion power, they become smaller and dimmer.

The practical upshot of all of this is that we can determine the ages of stars based on their HR diagram locations – for a given luminosity and color, there is an associated age.  This is particularly useful for low-mass objects, which take extremely long times to reach the main sequence: An M0 star probably takes 200 Myr to reach the main sequence (Dotter et al. 2008), while a brown dwarf will never reach any kind of main sequence, and will slowly cool and dim forever.

Typically, people use theoretical stellar evolution models like Baraffe et al. (1998), but in practice it is also possible to make empirical relations from known young stars with parallaxes, by fitting polynomials to them.  The diagram below shows a set of fifth-order (x5) polynomials that were fit to the single-star members of nearby young associations, as they appeared in Riedel et al. (2011).

A color-magnitude diagram of nearby young low-mass stars

A Color-magnitude diagram (Absolute V magnitude versus V-K photometric color) of M dwarf stars with parallaxes. The main sequence is represented by stars with trigonometric (annual) parallaxes within 10 parsecs of the Sun. M dwarf members of associations that are less than ~100 Myr old and closer than 100 parsecs are represented as colored and shaped items on the plot, and empirical isochrones are also shown.

As expected, we see multi-magnitude differences in the luminosity of Epsilon Chameleon members (pink) versus similarly-colored members of TW Hydra (yellow) or Beta Pictoris (blue).  On this basis, I presumed the nearby M dwarf AP Columbae was probably older than Beta Pictoris, but younger than AB Doradus (which annoyingly lies within the range of high-metallicity main sequence stars).

Of course, these polynomials are not perfect – they are dependent on the quality of the parallaxes and whether a star actually is a single, “normal” member of the group… and the polynomials are only useful between the boundaries for which there is data to fit.  As of the time when I made these polynomial fits, there were only two young brown dwarfs — both members of TW Hydra — with parallaxes AND Johnson V photometry, which is why all the other lines terminate at the middle and hotter M spectral types.  If I replaced the Johnson V colors with something redder (I or J-band) it would be a lot easier to produce empirical isochrones for brown dwarfs… although at the moment, extremely few young brown dwarfs are known.