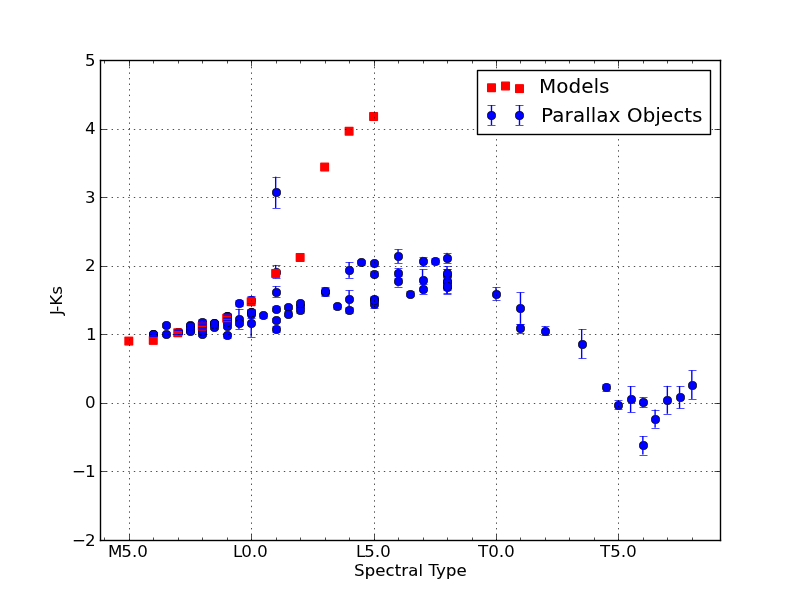
Here are color vs. spectral type plots for the 2MASS J, H and Ks bands.
The blue circles are for the objects with parallax measurements. The red squares are for the AMES-Dusty model spectra with spectral types gleaned from effective temperature according to Golimowski et al (2004).
-
- J-Ks vs. Spectral Type
-

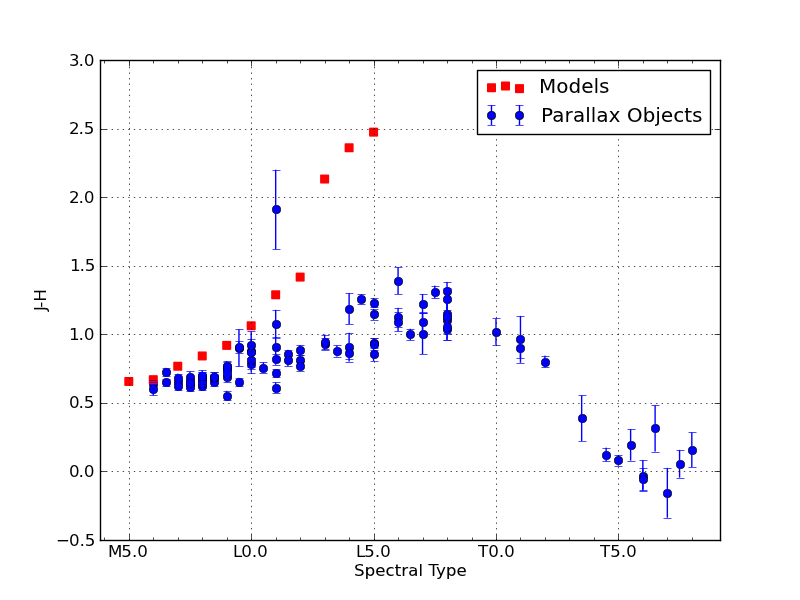
- J-H vs. Spectral Type
-
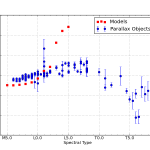
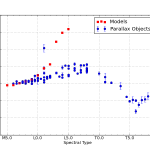
- H-Ks vs. Spectral Type
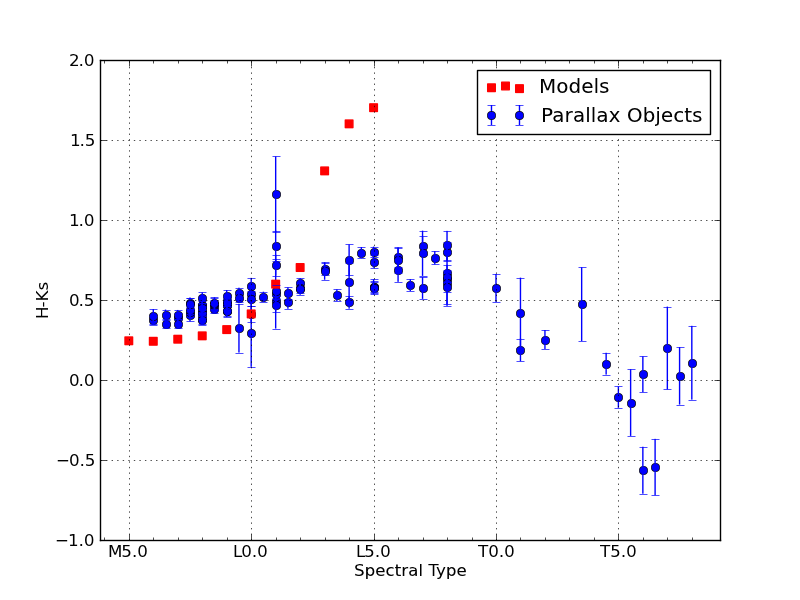
While the AMES-Dusty models are known not to be a good fit for objects with effective temperatures lower than about 2200K (shown by the disagreement in L dwarf colors of objects and models), the M dwarfs fit fairly well for J-Ks versus Spectral Type.
However, the models are under-luminous in J-H and over-luminous in H-Ks for M dwarfs, indicating a possible problem with H-band modeling. The models shown are calculated with a surface gravity of 5.5, which means that the models produce a “peakier” H-band than the objects actually exhibit.
In a color-color plot of J-H versus H-Ks, the H-band throws off the model colors on both axes causing a diagonal shift (bluer in J-H, redder in H-Ks) of M and L dwarfs compared to the models:
